J-pole Antenna Gain
J-pole antenna gain is a perfect opportunity to examine best-in-breed of great expectations backed up by poorly executed science. Let’s start with a question…
Which looks more believable?
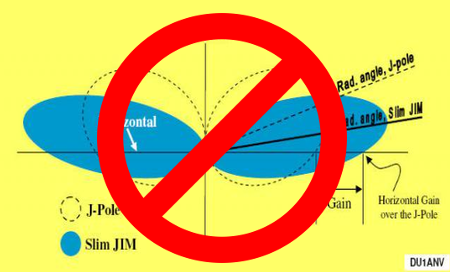
A – This drawing…
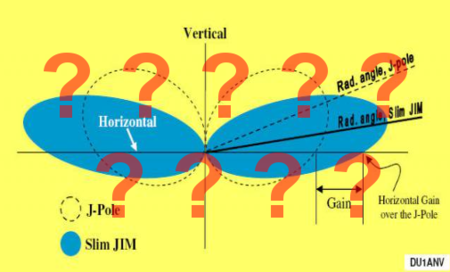
…showing an artist’s conception comparing the J-pole and Slim JIM antenna gain patterns likely based on a now well understood misinterpretation of Judd’s original work?
…or…
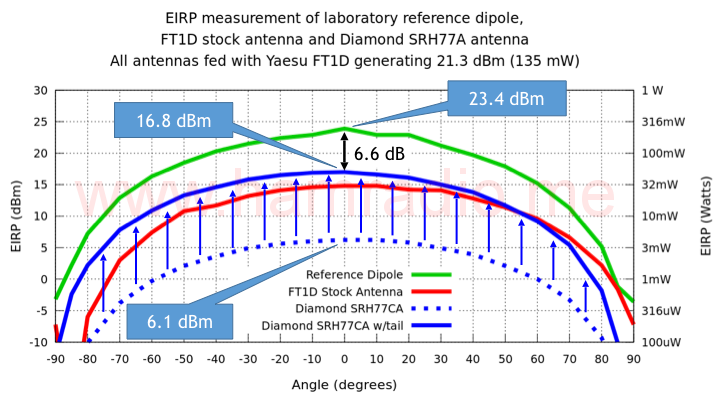
B – This graph of E-plane antenna gain…
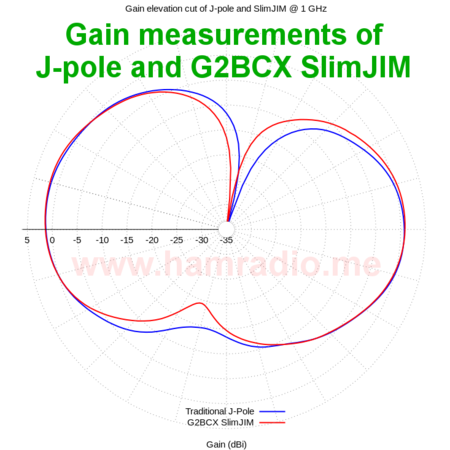
…plotting carefully made measurements of same?
Question marks added to figure 1 to ensure no one mistakes its appearance as endorsement of its erroneous conclusions.
So which do you believe – artistic expression or actual measurements? I’m just curious which source of information you believe more.
It’s interesting to note the original graphic of figure 1 seems to be no longer available where I originally found it on the web; Perhaps ‘ANV has seen the light and taken it down. Unfortunately the Internet is forever especially for information backing up false claims. There is a graphic image of the article still available here and at least one Ebay seller of Slim Jim antennas uses the graphic in their sales pitch.
Progenitor of Slim JIM misinformation?
Has the genesis of Slim JIM gainflation been found? Is figure 1 the missing link to what ails the Slim JIM antenna cottage industry? It likely played (and continues to play) an important role. The point in time where Judd’s 5/8’s wave reference antenna morphed to a j-pole probably occurred before the inception of DU1ANV’s graphic. As long as the graphic of figure 1 remains a popular defense of Slim JIM gain hype, it wins the misinformation trophy.
It’s not a stretch to trace the following whoppers to figure 1:
- “Increased gain: compared to a standard J-Pole the Slim Jim has about 6 dBi of gain” (sometimes called 6 dB) – FALSE
- “More RF energy aimed at the horizon: with a take-off angle of about 7 degrees for the Slim Jim, compared to 20 degrees for the J-Pole” – FALSE
Ironic justice?
Quite a few Slim JIM sellers have copied the DU1ANV diagram into their sales literature. As the graphic is incorrect, the joke is on them. Unfortunately the unsuspecting buyer relies on the seller to quote valid specifications and has no idea. Be careful what you copy from The Internet. One day you may sell to a technical buyer who will call your bluff. Then it won’t be a joke.
Conclusion
Here’s the test… if you write a technical research paper and present a graph like figure 1, will you be at all surprised if reviewers think “fake data” and summarily reject any premise made from said data? Despite the best of intentions, data portrayal like figure 1 paints the amateur community in a bad light. Worse yet, antenna manufacturers/sellers (who should know better) using such data look inept despite the functionality of their products.
