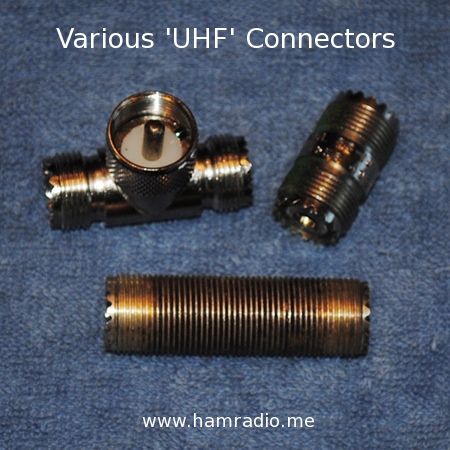
Continuing our posts concerning the PL-259 and SO-239 (aka UHF) connectors, we finally arrive at some real testing with real test results.
Before we test a single UHF connector, let’s first examine the Return Loss, Attenuation and Standing Wave Ratio (S11, S21 and SWR) of connectors designed after World War II.
As explained in the previous post the Device Under Test (DUT) is converted from the Vector Network Analyzer (VNA) SMA ports to the particular connector type. Then a barrel connector of the particular connector type resides in between the two adapters.
For the Return Loss and SWR runs, the far side of the DUT is terminated with a 50 ohm SMA precision load.
For the Attenuation run, both sides of the DUT are connected to the VNA.
A Baseline run was performed for all the tests. This is without any DUT attached. The VNA has male SMA connectors on its test cables. For the S11 and SWR baseline runs, the 50 ohm load was attached directly to a single VNA cable without any adapters. For the Attenuation run, a single female SMA barrel was placed between the cables.
I mention the Baseline details above because I did perform a test on an SMA connector by putting one SMA barrel in each cable and connected them with a male-male barrel. This sufficiently lengthens the time the signal is spent inside the realm of SMA so we can see the difference, if any, from the Baseline.
These tests were run from 30 – 500 MHz with a bandwidth of 10 kHz.
The VNA cables were calibrated with the open, short, load and feed-through technique to ensure the only effect seen is that of the DUT.
Let’s have a look at the Return Loss of the connectors along with the baseline.
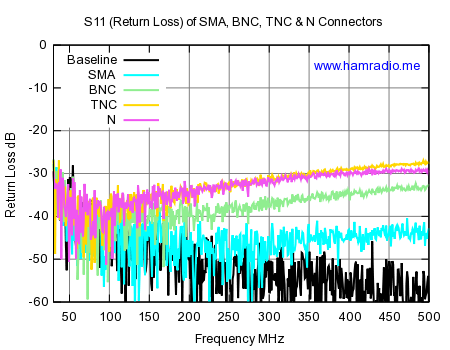
Return Loss measures the amount of energy reflecting back from the load. When things are perfect all the energy is absorbed by the load. We get very close to that perfection in the black Baseline plot. If we were to place a short or leave open the end of the coax, all the energy would reflect back and we would have Return Loss values near 0 dB. 10 dB return loss suggests 1/10th of the power is reflecting back from the load. 20 dB is 1/100th of the power reflecting back and so on. All of our post WW2 connectors easily achieve superb results in this test.
The baseline measurement is quite stunningly terrific. SMA wins the competition for best performance. Surprising to me, the BNC takes second place. I thought for sure the threaded TNC connector would be best… guess not. The BNC, TNC and N connectors have similar signal path proportions so it’s no surprise they are trending roughly the same way. Differences aside, they are all pretty awesome connectors.
The corollary to Return Loss is the good old Standing Wave Ratio and here it is in Figure 2…
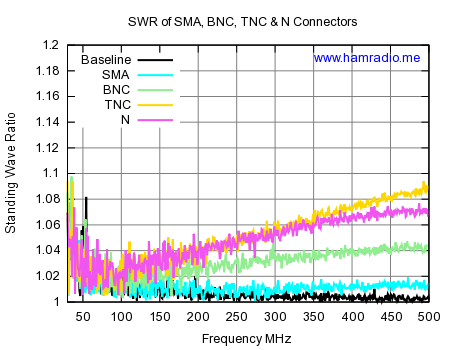
You can see the correlation between S11 and SWR. All the connectors perform well and do not contribute much to poor SWR.
Finally we get to the Attenuation test results in Figure 3…
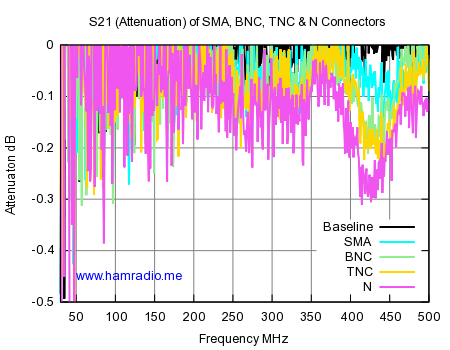
Again the baseline measurement, in black, is essentially lossless. For all practical purposes, these connectors attenuate the signal less than 0.3 dB… Very Good!
Differences in attenuation are observable, but almost in the noise. For all practical purposes the differences between these post WW2 connector designs are minimal.
Conclusion
Despite the subtle differences between the post WW2 BNC, N, TNC and SMA connector designs, we see they all perform quite well up to 500 MHz.
In the next post we will compare the above connectors with various configurations of the PL-259 and SO-239 styles.
